Horror Novels
Halloween has always been my favorite holiday. Not because I was or am a die-hard goth, enjoy movies that make me jump at shadows once they're over, or love costume parties. But because, at its heart, the ultimate point of the holiday is to have fun.
It's not a holiday commemorating a person or people, a historical event, or a religious ceremony, or a holiday requiring us to travel to spend time with family, or a holiday where gift exchange is mandatory. Can it be categorized as a commercial holiday like Valentine's Day, where the entire point is to spend money on decorations, costumes, and candy? Sure. But you can easily ball yourself up in blankets and do nothing but watch thematically-appropriate movies by yourself and most likely everyone will recognize that as an entirely valid way to enjoy the holiday. No matter which way you slice it, Halloween is about self-expression and having fun, regardless of age.
Shirley Wu and her Film Flowers project have always been in the back of my mind, ever since I started learning d3. I remember being blown away by how she programmatically drew the flowers and I wanted to know how to do it. I tried tinkering with svg paths back in the On The Nose project, but it didn't go well and I abandoned the plan to incorporate a sinuous timeline after a few troubleshooting attempts - it wasn't the point of the visualization and there were better, simpler options available that would help make understanding the visualization easier, so why not? (After all, knowing when to not force something is as important as knowing when you should, right?)
But with Film Flowers and Halloween in mind, representing the top horror novels as spiderwebs was literally a no-brainer. Seriously. I don't even recall thinking about it. Just ding! - idea popped fully formed in my brain.
With this project, I practiced my data cleaning skills in R, figured out how to calculate and draw SVG paths, and completed a data visualization project from start to finish in a matter of days. I'm quite excited about how it came out - it's exactly what I envisioned from the start, it's silly in a great way, someone on DVS Slack said it's inspiring them to read more horror, and, of course, it's a tribute to my favorite holiday.

After looking for a NYT's Best Seller's dataset that included genres and failing, I stumbled on Zenodo's Best Books Ever dataset, which "contains 25 variables and 52478 records corresponding to books on the GoodReads Best Books Ever list (the larges[t] list on the site)." It had all the data I was looking for, but as it wasn't specific to horror novels, I realized I could either subset the data for horror books with the highest rankings and take the top 20, or use an external list to validate which horror novels are considered the best of the genre.
I opted for the latter because of the validation - I don't read horror novels myself and would trust others' opinions of what's considered best over simply subsetting. The downside of this option is, of course, the external top 20 list would probably be biased for the most popular books, meaning some 'highly rated but obscure' horror novels could be left out of the top 20. However, a "highly rated but obscure" book would probably have fewer votes for ratings overall, and so the ratings data might not actually be representative of a population-wide vote. External top 20 list it was! I ended up using Goodread's Definitive Horror Book List.
I extracted the data from the list using ChatGPT, "collect the top 20 novels from this list into an array in the style of R" and after confirming accuracy, used this to subset the zenodo dataset.
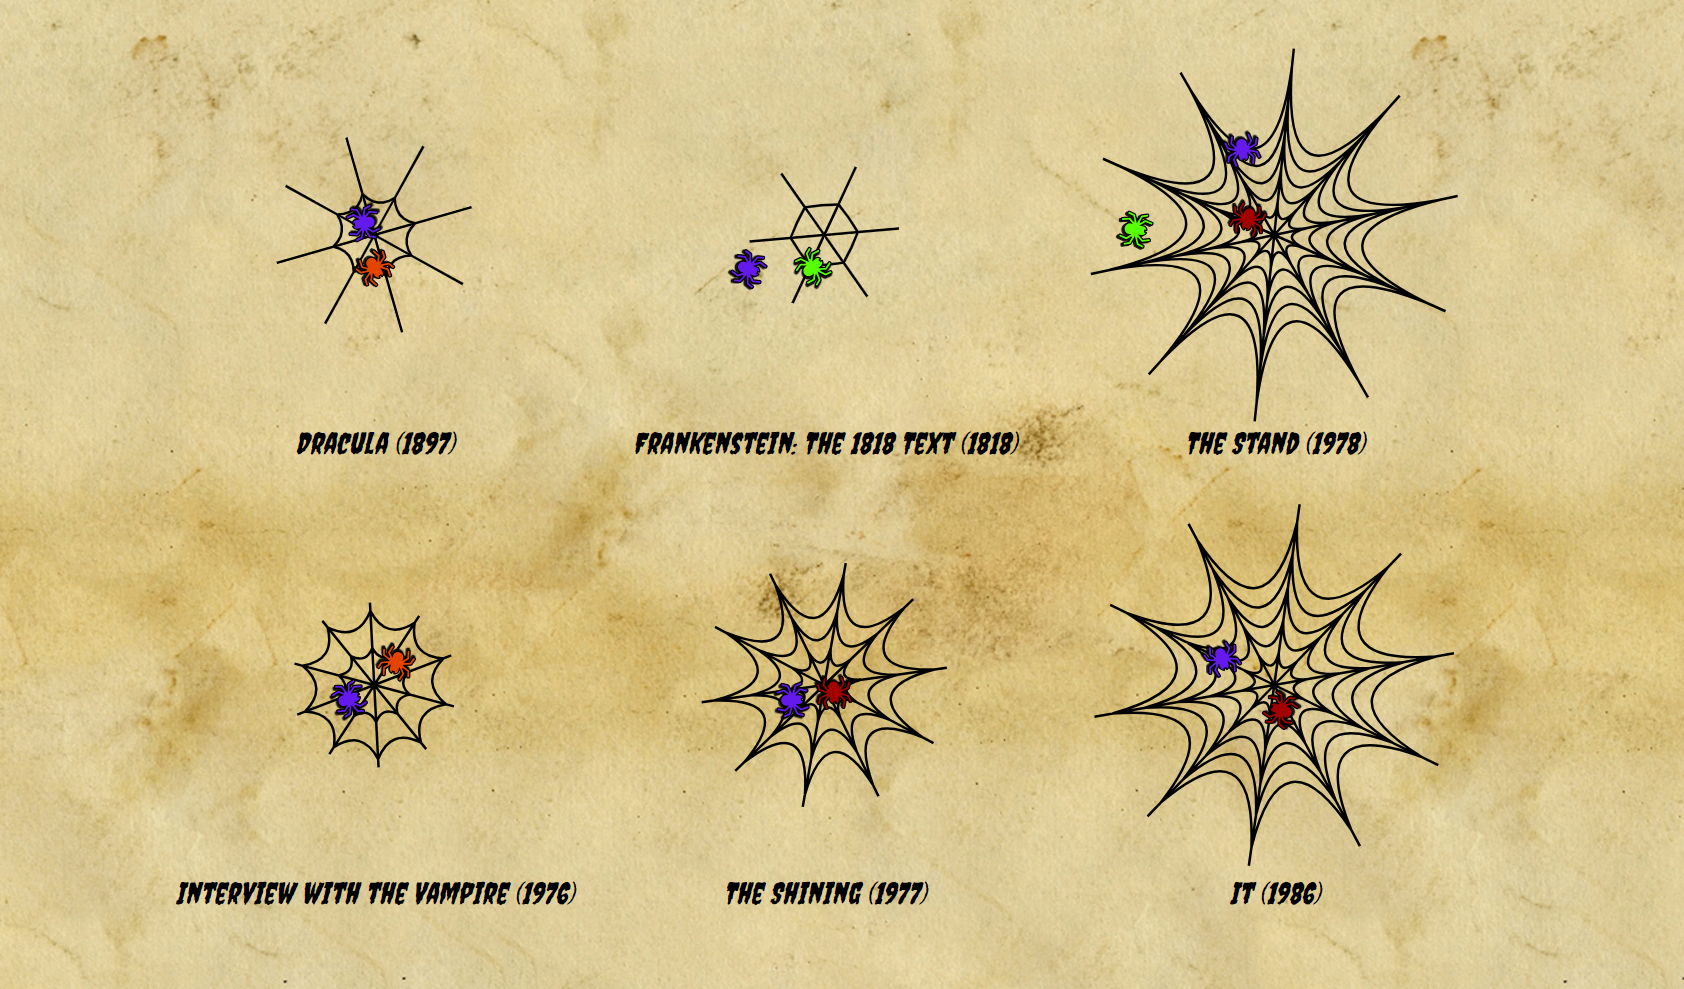
After looking at the 25 variables in the dataset and what data I had or could calculate, I sketched some spiderwebs. What were the elements of spiderwebs I could possibly encode the data to? Obviously there was the size of the web, there were the number of spokes, the lines emanating from the center point of the web, and there were the number of concentric rings about the center of the web, but what else? A center icon? Add a fly or a spider to represent something special? I also looked online at some spiderweb svg icons and from there had the idea about using the 'sagginess' of the filaments making up the concentric rings as an encoding option.

I sketched some encoding options while looking at breakdowns of the data in R to see what the ranges of data are, and ultimately these ended up changing as the visualization came together. Having age corresponding to filament sagginess would have been a nice metaphor, but ultimately there wasn't as much visual diversity between the various books/webs as I had hoped there'd be. Also, unless the filaments all sagged in the direction of gravity, the metaphor had its limits. In the end, the encodings were:
Age => Inversely correlated with number of spokes. I felt this kept an element of metaphor in the encoding because as webs decay, they naturally lose integrity (aka some spokes), right?
Pages => Radius size.
Number of Awards => Number of rings.
Rating => Filament sagginess. All the books were between 3.81 and 4.34 on the out-of-five scale, so I thought this would be an interesting way to milk that spread for as much as I could.
Genres => Color.
The last thing to figure out was color. How was I going to incorporate color? I knew I wanted to link explicit genres in a halloween-themed color palette (created by hand using coolors), but unlike flowers, there's no natural avenue for spiderwebs to contain pigment. Do I just make slightly transparent circles behind the webs ala Film Flowers and hope it looks good? Instead of the black webs, do I change the stroke color to be a gradient of the genre colors? Do I had other elements to the web? I actually made the decision after I finished coding the webs to incorporate actual spiders into the spiderwebs and have those be the color vectors.
After subsetting the data to create the top 10 dataset, I cleaned the genres and removed the following: "Horror" and "Fiction" (applicable to every book), "Audiobook", "Classics", "Novels", "Literature", "Poetry", and "Short Stories", (not really genres so much as type of media), "Adult", "Adult Fiction", and "School" (describes the target audience), "Gothic", "19th Century", "Historical Fiction", " (more because they were odd-balls that didn't fit into anywhere else, so I elected to ignore them) and "Mystery Thriller", "Science Fiction Fantasy", "Ghost Stories" (redundant with the five main categories). The five main categories were:
Fantasy: Fantasy, Urban Fantasy
Thriller: Thriller, Mystery, Suspense
Supernatural: Supernatural, Paranormal, Vampires, Ghosts, Zombies
Scifi: Science Fiction, Dystopia, Apocalyptic, Post Apocalyptic
Drama & Crime: Drama, Crime
The hardest part of with this cleaning operation was putting the data back into an array so it'd be json-friendly when I went to plot with d3.
Calculating the age of the book was honestly the biggest pain of this process. Working with time has always been an Achilles' hill for me. I tried cleaning the dates in R but because the date format had years has two digits instead of four, the centuries ended up being wrong for half the books. Then I double checked the publication dates because I noticed a lot of them had October 28th as their publication date and that struck me as odd - and half of them conflicted with the publication date listed on their goodreads profile page. Rather than fix the dates cell by cell and deal with reformatting all the dates in R, I decided to clean the publication dates by hand in excel and then calculate their age after re-importing the data because it took a fraction of the time.
While I was cleaning the dates in excel, I also realized I wanted the number of awards at this point and as the awards were saved in an array of strings like genres, meaning I'd have to redo the entire process for awards, I just counted them by hand and make a new column in excel. Easy and time-saving because there were only 20 books. Work smarter, not harder?
At the end of the process, I had reduced zenodo's 25 variable set to 7: title, main author, pages, rating, number of awards, genres, and age.
Experience with creating data-driven svg paths was the main point of this project, so I wanted to include the 'figuring it out' process in the write-up.

There were two ways to draw the spokes of the web: Either start with the center then draw each spoke individually from the center, or start with one spoke, and use math to calculate where the next one should be. Then I'd only need to draw half the lines, right? Well, I went through this whole rabbit hole of trying to calculate the spoke end-points using arc lengths or chords before realizing I was overcomplicating the matter in an effort to minimize how many lines I had to draw, and the trade-off wasn't worth it. Keep it simple, silly.


Next, I had to actually make the functions to calculate all this. Surprisingly, it wasn't as complicated as I thought it'd be! First, let me say I am a big fan of pseudocoding. I think it's because my first semester at Georgia Tech, our matlab exams were multiple choice and pseudocode-based to start with before transitioning to actually coding on computers in the lecture room. But whenever I want to plan math-heavy code still, I write it out.


Before worrying about plotting them with d3, I checked the paths my functions were outputting using codepen.io. It took a few rounds to iron out the kinks, but in the end everything worked as intended.

The actual process of creating the webs with d3 was relatively straightforward, and some of the process is documented in my Gallery of Whoops. Adding the spiders was the only non-trivial part remaining. I used Math.random() liberally to add spiders in a code-generated, random way that would also minimize spider overlap as much as possible. It isn't perfect, but it works, and I'm trying not to let perfection stand in the way of done these days, so good enough.

Lastly, I wanted there to be as many sources of randomness in the final visualization as possible so that each time someone opens or refreshes the page, it's slightly different. In addition to the spider placements being somewhat randomly generated, the spiders as well as the spiderwebs themselves are rotated a random amount on each load and webs with only one ring (aka books that didn't receive any awards) have their ring's radius calculated with randomness. I tried shuffling the order of the books about as well, but some of the long titles, if they were next to each other, would overlap. I decided it'd be better to keep the books static than shuffle the order and disrupt the aesthetics of having one-line titles throughout.
I started with my 'ideal' halloween color palette by simply selecting the colors I associate most with Halloween - witchy purple, pumpkin orange, candy corn yellow, disney villain green, and blood red. Once I plotted the spiders, I tweaked the colors slightly to improve the contrast with the yellow-toned vintage paper background I selected - basically all the colors except green got lighter.


And as a final step, I checked accessibility using Adobe Color. There was unfortunately a problematic overlap between the green and yellow colors for those with Protanopia.

However, after a lot of tweaking, I couldn't find another suitable color that removed the overlap while also keeping the yellow distinct enough from the background yellow tones. And if I made the 'disney villian' green darker, it'd conflict with the orange. And if I made the orange darker, it'd conflict with the red. So I took a look at the actual spiderwebs to decide what to do. Given that the genre assigned the yellow color, Drama & Crime, had the fewest overall spiders, the green genre, Scific, had the second-fewest, and only one web contained both a green and yellow spider, I decided that the yellow-green overlap was the "best" or "least problematic" option to keep. Win some, lose some.
I posted this for critique in the DVS slack. The feedback centered on the fonts I chose, the Creepster for the traditional halloween-looking font and Charm for a more old-timey script font that I used for the footer and legend. However, Charm and some of the elements like a drop-shadow on the book titles were decreasing legibility. Taking in this feedback, I swapped Charm for good ol' Book Antiqua, deleted the drop shadow on the titles, replaced Book Antiqua with Creepster for the legend, and increased line-height in the footer.
From Lisa Ito's feedback:
This is so cool! Perfect for the season and definitely inspiring me to read more horror! I'm hoping to learn D3 soon and it's awesome to see it applied to a fun topic.
And all my friends loved it.
Happy Halloween everyone!